
The Problem of Synchronization
Markets play an important role in synchronizing the cycles of production of goods and services with the cycles of their consumption.

Introduction
Why do market prices often seem to fluctuate within a narrow range while at other times they shoot up or drop down? A conventional answer is that market prices reflect the balance between supply and demand, with increases in price when there is a shortage of supply or decreases in price when there is a shortage of demand, and sharper increases and decreases when the supply or demand are more “inelastic” meaning less likely to change in response to changes in price. But the conventional answer doesn’t explain what causes the shortages, or why supply or demand might be more or less inelastic.
This essay suggests an answer to these questions that is based upon observations of how goods and services are produced and consumed. Production of goods and services presents not only difficulties of obtaining necessary supplies, labor, and capital, but also of timing. Goods and services are both produced and consumed within a period of time characteristic of the particular goods and services. In this essay, I explain how production and consumption can be modeled as periodic cycles. Through examples I illustrate these cycles and how they interact with each other through markets. Markets play an important role in synchronizing the production of goods and services with their consumption. Market prices provide a signal that feeds back into individual decisions about production and consumption, and the relative magnitude of fluctuations in market price reflects the coupling and decoupling of production and consumption.
Definitions
If we define a market as a group of buyers and sellers who exchange payments for goods or services, then we can call what the buyer pays a price. The price can be measured in some units of fungible currency per some units of goods or services offered by the seller. To simplify explanation, I’ll use as an example apples being sold for dollars at a Farmer’s Market in the United States, but other units of currency and other goods or services could be substituted for dollars and apples without loss of generality to what follows. Thus, a buyer might offer to pay $1 for an apple and a seller might offer to sell an apple for $1, and the buyer and seller might thereafter complete a transaction at the price of $1 per apple. Often the buyer’s offer is called a “bid” and the seller’s offer an “ask.”
What is the market’s purpose? Why does this group of buyers and sellers form? An important part of the answer is price discovery. A buyer’s bid remains hidden from sellers until the buyer makes the bid explicit as an offer. A seller’s ask remains hidden from buyers until the seller makes the ask explicit through an offer. The market thus serves as a mechanism for price discovery, which would otherwise be more difficult or impossible. In the example of the Farmer’s Market, the price discovery mechanism is rather pedestrian: buyers walk around to see and hear the sellers’ asks, and are free to bid lower if an ask is too high. When a bid and ask match, a transaction can be completed, with dollars and apples exchanged on the spot.
Market Prices and Quantity
Both a number of dollars and a quantity of apples are at least implicit in the price of every bid, ask, and completed transaction. If a farmer asks $10 for 5 apples but the buyer bids $10 for 10 apples, then there will be no apples sold even though the buyer has $10 and the farmer wants $10. Every price, whether it is associated with a bid, an ask, or a completed transaction, is measured in both dollars and units of apples. In the case of our Farmer’s Market in the United States, the units of apples is typically pounds. The fact that any price is measured in dollars per pound of apples is intuitive: If I want more apples, I have to pay more dollars.
But not always. After hanging around a Farmer’s Market for a while, one may observe the buyer’s tactic of bidding a lower per unit price for a larger number of apples. If the farmer is asking $1 per apple and I want 5 apples, then the farmer is unlikely to accept less than $5. But if the farmer is asking $1 per apple and I want 500 apples, then the farmer might well accept an offer of $400, or $0.80 per apple, a 20% discount from their original asking price.
Why would the farmer accept less for more? The answer has to do with time, and in Parts 2 and 3 below I explain what I mean by this more fully. For now, I want only to acknowledge that the buyer’s tactic of bidding lower for a larger number of apples can backfire. Imagine a buyer who represents a bakery that needs 500 apples for 100 apple pies that it has promised to deliver to a Fourth of July Picnic tomorrow, with nowhere else to buy apples between then and now. If the farmer either knows, or even just senses, the urgency of the buyer’s need, then the price may go up! If the farmer knows, for example, that the same 500 apples will sell for $1 to some other buyers anyway, then the farmer might ask the buyer for more than $1 per apple.
Market Prices and Time
What these examples show is that prices are not only a function of quantity, but of time. While the explicit price of apples may be given in terms of dollars per pound of apples, always implicit is the period of time (sometimes called “time horizon” or “window of time”) over which the apples will be delivered. In the case of our Farmer’s Market, there is no negotiation over when deliveries will be made because payment and delivery happen on the spot. The convenience of on-the-spot payment and delivery is a big advantage for the Farmer’s Market over other markets, which helps explain why buyers and sellers are willing to inconvenience themselves by showing up at a certain time and place without any guarantee in advance that there will be any transaction. With buyers and sellers remote from each other, many additional terms beyond the price per apple need to be negotiated, including how the apples will be delivered, how the buyer will make payment, and what will happen if the delivery or payment is not made in a satisfactory manner. While these additional terms can be negotiated and transactions can still be completed, it’s worth noting how much of a market economy is devoted to solving these problems, which are solved implicitly at the Farmer’s Market when the payment and delivery are simultaneous. In the end, whether implicit or explicit, the price in every bid, ask, or completed transaction is also specific to a particular period of time. A bid or ask that is too early or too late to be accepted is as good as no bid at all, regardless of the number of dollars or apples being offered.
Markets Synchronize Buying with Selling
This leads to my central claim: The synchronization of buying and selling is a basic function of markets. More specifically, the synchronization of bids with asks into completed transactions is an important part of market price discovery mechanisms. In the discussion of examples that follows, I illustrate how markets solve the problem of synchronization.
Let me caveat my claim by acknowledging that markets are not the only mechanism for solving the problem of synchronization. Before and beneath all markets is biology. I cannot eat an apple that has not grown. Before markets, if my neighbor had an apple orchard and I liked eating apples, then I might still be able to eat apples. Gift and barter economies in more primitive societies demonstrate that even before markets, humans were able to synchronize cycles of production with consumption, with some research suggesting even that human metabolic cycles may synchronize in response to food sharing.[1] I view markets as simply a way to extend more primitive mechanisms for synchronization over larger and longer scales.
Other mechanisms for solving the problem of synchronization are also available, such as central planning. It was direct observations of entrepreneurs engaged in central planning — the assembly line at Henry Ford’s River Rouge works — that inspired Ronald Coase to write The Nature of the Firm.[2] But central planning is hard to scale. As Hayek pointed out in The Use of Knowledge in Society, central planning requires a large amount of private information about consumption and production. Barring access to and the ability to process that detailed information, synchronization of consumption and production through markets remains the only available option at scale. Central planning also has known problems with fraud and abuse, at least some of which markets can avoid. Yet we must acknowledge also the limitations of markets. Markets remain vulnerable to instability and catastrophic failures.
The remainder of this essay is divided into three parts. In part 1, I explain how the buying and selling of a given quantity of goods or services can be modeled as cycles of characteristic frequency. Because every price associated with bids, asks, and completed transactions has units per period of time, every price also has an implicit frequency.[3] In part 2, I describe how markets synchronize buying and selling by shifting the start or changing the frequency of either or both of the cycles of consumption and production through the coupling mechanism of market price signals. In addition, I describe how steady cycles of consumption and production lead to stable market prices. In part 3, I describe how instabilities may arise, preventing synchronization and leading to market failures. I conclude with a short summary.
Part 1. The Cycles of Consumption and Production
Hidden by the large number of transactions at the Farmer’s Market is an important fact about the buying and selling of apples: Every buyer’s bid and every seller’s ask is made with a characteristic frequency. Each buyer consumes only a certain number of apples a week, and the entire group of buyers consumes, on average, only a certain number of apples a week. Given a unit, the period of time over which the unit is consumed may be called a cycle of consumption and the period of time over which the unit is produced, a cycle of production.
The Frequency Distribution of Consumption
We can measure the frequency of cycles of consumption at the Farmer’s Market in apples eaten per week because the Farmer’s Market meets once a week, so in principle our buyers can replenish their supply at that frequency. We chart this frequency distribution as a histogram plot with the number of apples consumed per week on the x-axis and the number of buyers at the Farmer’s Market who consume a number of apples within a given range on the y-axis.
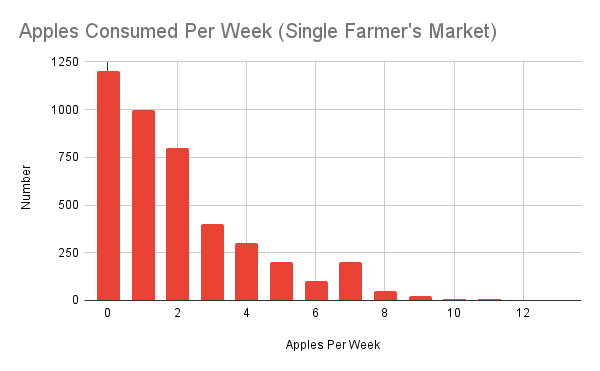
Figure 1. The Frequency Distribution of Apples at a Farmer’s Market
Three features of this frequency distribution are worth noting. First, there are many people, even at our Farmer’s Market, who eat zero apples per week, but those people are left out of this histogram, which shows only the frequency of apples eaten per week by apple buyers at the Farmer’s Market. If non-apple eaters were plotted, then the plot at exactly zero would be much larger than the number plotted in the largest and leftmost range from zero to one. But even leaving out the non-apple eaters, most apple buyers consume less than an apple per week. Apples properly stored can keep for several weeks, some apples still spoil before they are eaten, and most apple buyers are buying apples not just for themselves but for their families. For these reasons, the frequency distribution peaks between zero and one, as shown in the histogram.
Second, the distribution has a fat tail. The fat tail represents apple enthusiasts, and includes a small peak at 7 to 8 apples per week, representing the group of people who follow the proverbial doctor’s advice by eating an apple a day. Beyond these, there are still one or two true fanatics, who eat even more than an apple a day, perhaps because they’re on an only-apples diet or apple juice cleanse. The result is a frequency distribution that is skewed to the right with a fatter tail than would be found in a normal (Gaussian) distribution. One consequence of this is that the average (mean) number of apples eaten per week is almost 3, but the median number of apples eaten per week is less than 2.
Third, this frequency distribution applies only during apple season. No apples are sold during the winter and spring. This important caveat shows how the shape of frequency distributions can be a function not only of the size of the window of time over which frequency is measured, but also of which particular same-sized window of time is measured. A frequency distribution whose shape does not change depending on which window of time is measured is called stationary. In our case, because of seasonality the frequency distribution is not stationary, but we will ignore this fact by limiting ourselves to measuring the frequency distribution during apple season.
To make a fair comparison of the frequency of consumption to the frequency of production, we need to look at not just the apples consumed by buyers at a single Farmer’s Market, but at the apples consumed by buyers at all Farmers’ Markets throughout a given week in our local area. If we assume that the frequency distribution of apple consumption is the same at each, then the total number of apples consumed is simply the number of apples sold at a single Farmer’s Market multiplied by the number of Farmers’ Markets, leaving the shape of the frequency distribution unchanged. See Figure 1B, which shows the total number of apples consumed per week in the local area assuming there are five Farmers’ Markets with the same frequency distribution of consumption shown in Figure 1.
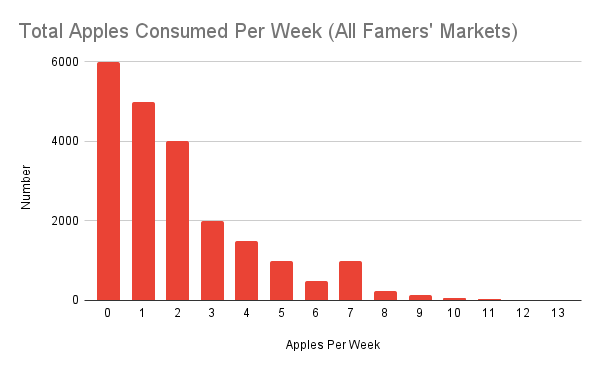
Figure 1B. Frequency Distribution of Total Apples Sold Per Week
Assuming the apple farmers attend all Farmers’ Markets during apple season, having the total frequency distribution of apples eaten per week allows an apples-to-apples comparison with the frequency distribution of apples produced, which is described next.
The Frequency Distribution of Production
Also hidden from view at the Farmer’s Market is the frequency distribution of production. Each seller of apples at the Farmer’s Market — that is, each apple farmer — grows apples at a characteristic frequency, and the entire group of apple farmers grows, on average, only a certain number of apples each season. Again we can measure how many apples are grown by the entire group of apple farmers, and again we find a discrete frequency distribution, which is charted as a histogram plot with ranges for the number of apples grown by a given farmer on the x-axis and the number of farmers who grew a number of apples within that given range on the y-axis.
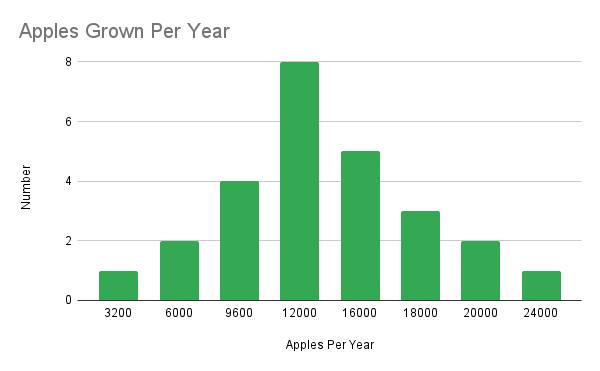
Figure 2. A Frequency Distribution of Apple Production
Each range on the x-axis (in histograms, often called a “bin”) shows how many apple farmers grew a given number of apples within that range. Apple trees produce around 600 apples a year, so we can estimate that the smallest orchard has about 5 apple trees, which produce a little over 3,000 apples. In this frequency distribution, only one of the farmers has an orchard this small. The largest number of farmers, the set of 4 farmers represented by the bin for between 12,000 and 15,000 apples per year, have orchards with about 20 apple trees each. The single largest orchard is represented in the bin for more than 24,000 apples per year. The farmer who owns this orchard has more than three dozen apple trees.
The frequency of apple production and the frequency of apple consumption do not match: whereas we measure apples eaten per week, we measure apples grown per year. In one sense this frequency mismatch is trivial. Since we are only measuring these frequency distributions during apple season, we need only assume that the apples can be harvested and brought to the Farmer’s Market faster than they are eaten each week during the harvest season. So long as that is true the numbers shown in Figure 2 can be divided by the number of weeks in apple season, and the frequency distribution of production will have the exact same shape, except with numbers representing the number of apples produced each week rather than each year. Figure 2B shows the apples produced per week assuming a 16 week apple season.
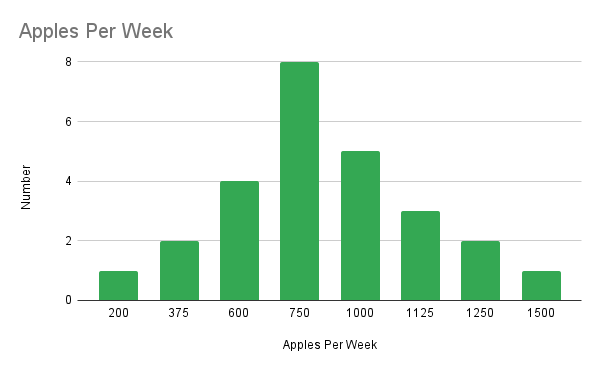
Figure 2B. A Frequency Distribution of Apples Produced Per Week
In another sense, however, the mismatch in frequency between production and consumption is more problematic. If we imagine the life of an apple as a relay race, which starts in the apple farmer’s orchard and ends when it is eaten by an apple buyer, then each completed transaction represents the handoff of a baton (in this case, the apple itself) from the apple farmer to the apple buyer. That handoff cannot happen too early (before the apple has finished growing and been harvested) or too late (after the apple has gone rotten). The cycle of consumption (i.e., the eating of apples shown in Figure 1) must be synchronized with the cycle of production (i.e., the growth and harvesting of apples with the frequency distribution shown in Figure 2). In general, the frequency of consumption and the frequency of production do not match. This mismatch of frequencies gives rise to what might be called the problem of synchronization.
To reiterate my central claim, the synchronization of production with consumption is a key function of the market. Some analyses of markets, and of price discovery mechanisms in particular, have focused on the effect of changes in price on the quantity of goods consumed or produced. Part of my argument in this essay is that both quantity and frequency must be considered in analyzing market mechanisms. The remainder of this essay is devoted to showing how the lens of synchronization provides another useful tool for understanding how scarce resources are allocated by markets.
Part 2. Markets and Synchronization
Markets synchronize buying and selling by coupling production and consumption through two mechanisms: (1) shifting the start of cycles of consumption and production relative to each other or when a market opens, and (2) changing the frequency of cycles of consumption or production. In the terminology of signal processing and analysis, these are called phase shift and frequency modulation, respectively, and I will follow that terminology here. Either or both mechanisms may bring the end of cycles of production into alignment with the start of cycles of consumption. I describe both mechanisms, in turn, and illustrate them through the example of the Farmer’s Market.
Key to understanding both of these coupling mechanisms is the way that market price signals serve as a proxy for information about the frequency distributions of production and consumption, illustrations of which were shown in Part 1. In general, buyers and sellers do not share information about their cycles of consumption and production. This is true in part because of the practical problems with communicating, storing, and processing that information and in part because only relative differences in frequency matter. An apple buyer doesn’t need to know exactly how many apples a farmer harvested. What matters is how many apples the farmer can sell at a given price relative to other apple farmers at the Farmer’s Market that week. Likewise, the farmer doesn’t need to know how many apples the apple buyer plans to consume. What matters is how many apples the buyer is going to consume relative to other apple buyers at the Farmer’s Market that week. Market prices thus serve as a highly compact signal of where a particular consumer or producer fits within the cohort of their frequency distribution. Changes in market prices signal a shift in balance between the cycles of production that have occurred before and the cycles of consumption that are anticipated to occur after. Both market mechanisms rely upon market price signals to synchronize cycles of production with cycles of consumption.
Phase Shift
The simplest-to-understand market mechanism for synchronization is phase shift. A phase shift in a cycle of consumption or production occurs when the cycle starts earlier or later than it would have absent the market. Suppose it is the last week in May. The frequency distribution shown in Figure 1 is flat because apples are not yet in season. During the first week in June, however, the earliest apples to be harvested are offered at the Farmer’s Market. If the farmers with the early harvest do not ask for a higher price, then higher frequency consumers — the apple fanatics in the tail of the distribution — may consume the entire inventory of apples available that week, leaving casual apple consumers to wait until the following week. A higher asking price thus signals the farmers to bring more of their apples to market sooner, casual consumers to wait another week or two until prime season, or both. Conversely, if the early harvest offered at the Farmer’s Market does not sell without prices being lowered, then farmers will bring their apples to market later in an effort to adjust their production frequency to the current season’s frequency of consumption. In either case, if phase shifts alone are insufficient to compensate for imbalances between production and consumption then there will also be frequency modulation, which is described in the next section of this essay.
Figures 1 and 2 illustrate how the frequency distributions look later in the season, when cumulative production slightly exceeds cumulative consumption, with corresponding stability in market prices. Once cumulative production and consumption are in balance, deliberate phase shifts in individual cycles of consumption or production are smaller or non-existent as random phase shifts in consumption and production tend to cancel out — a consumer’s family vacation cancels with a farmer’s family vacation; a consumer’s apple pie eating contest cancels out with a producer’s bumper crop from a few of the healthiest trees in the orchard. Only persistent mismatches between cumulative production and consumption lead to changes in average market price from week to week and phase shifts or frequency modulation.
The decision of when to start a cycle of consumption or production may seem arbitrary when there is a large volume of transactions. In scenarios like the Farmer’s Market, which tend to be common for consumers in the developed world, we almost never think of cycles of production, much less their timing. Rather, if we concern ourselves with timing at all, then it is with timing of delivery and payment. Yet concerns about delivery and payment themselves provide an excellent illustration of phase shift.
Consider how delivery and payment services are themselves offered through a market of comparable delivery and payment services. A delivery service that picks up goods (i.e., has lower latency) and delivers them quicker (i.e., has higher frequency) is more desirable than a delivery service that lets goods sit with the producer for longer before being picked up, or is slower to deliver after pickup. Similarly, a payment service that allows immediate processing (i.e., has lower latency) and quicker settlement (i.e., higher frequency) is more desirable than a payment service that has a delay before processing or slower settlement. Why more desirable? Because lower latency and higher frequency give more freedom to the consumers and producers in deciding when to start a cycle of consumption or production. Simply put, markets for delivery and payment services are markets for freedom to phase shift cycles of consumption and production. Consumers will often pay more for lower latency and higher frequency delivery because that allows them to accelerate or delay decisions about when to start cycles of consumption. Producers will often pay more for lower latency and higher frequency payments because that allows them to accelerate or delay decisions about when to start cycles of production.
Why often but not always? Because sometimes the lower latency and higher frequency aren’t necessary given the period of cycles of consumption or production. Consider an online purchase of a pair of shoes. It is rare for the online purchaser of a pair of shoes to be replacing their only pair of shoes, which has already worn out. Hence, shoe deliveries tend to be higher latency and lower frequency than deliveries of prescription eyeglasses. Still, many shoe producers offer lower latency and higher frequency delivery services as an option. These options are made available because some purchasers have less freedom to shift the phase of their cycle of consumption. Perhaps the purchaser wants the new pair of shoes ready for the first day of school or job interview. Similarly, shoe producers do not demand cash payments from online purchasers. While low latency is desirable for both consumer and producer (who wants to stand around waiting minutes for a transaction to process?), settlement doesn’t have to happen immediately because, among other reasons, the shoes may be returned and the transaction reversed within a few weeks. As a result, the frequency of settlement cycles can be adjusted to a monthly schedule, matching the frequency at which the economics of transactions becomes final. Already in this discussion of delivery and payment services we are anticipating the frequency modulation mechanism of market synchronization, but the main point here is that delivery and payment services have evolved to allow phase shifts in cycles of consumption and production. Without delivery and payment services, or some other form of credit, which itself gives rise to an epicycle of borrowing and repayment, delivery and payment must be simultaneous.
Spot markets, like our Farmer’s Market, represent the case in which delivery and payment are simultaneous. In a spot market, the role that the market plays in shifting the start and end of cycles of consumption and production becomes more obvious. We see the mechanism of phase shifts at work both in the seasonality of apple sales and in the weekly schedule of the Farmer’s Market. Because apples are grown on an annual cycle that begins and ends within a period of months, cycles of consumption cannot begin until farmers start harvesting apples from their orchard in the summer, and ends after all of the apples are either sold or rotten in the fall. Consumers who want to eat apples at other times of year must find other sources, perhaps south of the equator where the seasons are reversed, and indeed apples are shipped from South America into North America to meet demand when apples are not seasonal in North America.
Slightly less obvious is the role played by the regular weekly schedule of the Farmer’s Market. Consistency in the timing and location of a Farmer’s Market is necessary to its success. There seem not to be too many roaming Farmers’ Markets. Rather, Farmers’ Markets meet the needs of a local region, setting up in a centrally accessible location on a consistent (usually weekly) schedule during daylight hours. The consistency in time and place are crucial to maximizing the number of buyers and sellers who are available to complete transactions. This is true not only because consistency makes it easier for buyers and sellers to know where and when to meet, but also because consistency allows the start of cycles of consumption and production to be planned. Instead of buying all the apples I might want to eat this year the first week they show up at the Farmer’s Market, I can buy what I need for that week. Instead of picking all of the apples early in the season while they are still ripening, farmers can leave some to ripen until later in the season knowing how many apples tend to be sold per week. The duration of the period of time that elapses between when a market is open and when it is open again thus lends itself naturally as the period to which both consumers and producers adjust the phase and frequency of their cycles of consumption and production in response to changes in average market price.
Frequency Modulation
In addition to shifting the start and end of cycles, markets also speed up or slow down cycles of consumption or production through market price signals. Speeding up or slowing down a cycle — i.e., shrinking or stretching the period of time over which a single cycle occurs — is called frequency modulation. Frequency modulation is the “FM” in FM radio, which modulates the frequency of a carrier wave in broadcasting an audio signal from radio towers to your home, car, or smartphone.
Frequency modulation is harder to observe than phase shifts, which adjust the start of a cycle, but not the period of time required for the cycle to run, making the proxy of market price signals even more important to the mechanism of synchronization. A cycle that starts early or late is easier to observe than a cycle that runs a little quicker or a little slower. Often the only person who knows whether a cycle of consumption or production is speeding up or slowing down is the person responsible for that specific cycle of consumption or production. When buyers show up at the Farmer’s Market, they don’t announce how many of the apples they bought last week were eaten and by what day of the week. Sellers don’t announce how many apples are left in their orchard to be harvested, whether still on the trees or in bushels at the farm waiting for next week’s market. What is announced are market prices.
Market prices are a high-frequency signal relative to the frequency of cycles of production or consumption. At the Farmer’s Market, prices may change over the course of a morning or from week to week whereas apples are consumed over days and harvested over the course of months. In this Part 2, I describe how changes in market prices synchronize production and consumption into stationary frequency distributions, leading to stable market prices. In Part 3, I revisit this observation about the relative difference in the frequency distributions of production and consumption and changes in market price signals in describing market instabilities. In any case, an important observation is that price is a function not only of currency per unit of goods or services per unit time, but also of the specific period of time at which the price is quoted. A price of $1 per apple per week when the Farmer’s Market opens on the morning of August 31 is not the same signal as the price of $1 per apple per week on January 31, or even the price of $1 per apple per week later the same morning on August 31. The frequency distributions illustrated in Part 1 may be almost the same from week to week (Part 2) or may change more dramatically (Part 3).
The market mechanism of frequency modulation is easier to observe by referring back to the frequency distributions of consumption and production from Part 1, reproducing their data in slightly different form. Figure 3 shows the frequency distributions of consumption (Figure 1B) and production (Figure 2B), but in cumulative form. In cumulative form, instead of looking at the number of consumers or producers within some range of frequency, we sum the number of consumers or producers within that range with all of the consumers or producers up to that range. The y-axis is the same for consumption and production in Figure 3, but to make it easier to see where the curves intersect, the x-axis of production has been reversed, running from highest to lowest. The curves on the left side of Figure 3 thus represent only the least frequent apple buyers but all of production, including the biggest orchards whereas the curves on the right side of Figure 3 represent all consumption, including the apple fanatics, but only the smallest orchards in production.
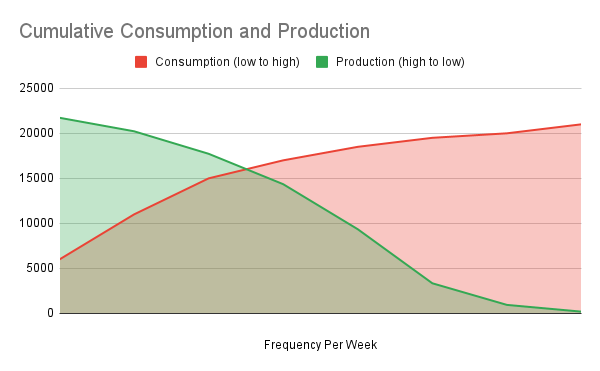
Figure 3. Cumulative Distribution of Consumption (Red) and Production (Green)
Figure 3 shows that per week production slightly exceeds per week consumption: The cumulative peak of production on the left at almost 22k apples per week is just under the cumulative peak of consumption at just over 21k apples per week. There is no shortage of apples and almost every apple produced each week gets consumed. The curves cross at about 16k apples per week, which coincides with the peak in the (non-cumulative) frequency distribution of production shown in Figure 2B, but extends well beyond the mean and median of the (non-cumulative) frequency distribution of consumption shown in Figure 1B. Only about a quarter of all apples consumed are produced by the long tail of lower frequency apple farmers. Similarly, only about 20% of all apples consumed are consumed by the long tail of higher frequency apple eaters.
How did these distributions evolve? Over a period of years, the cumulative production shown in Figure 3 grew to match cumulative consumption. Orchards take years to grow. But in the absence of a market, producers had no alternative but to give or barter away any apples they grew in excess of what they themselves could consume or share with their family and neighbors. Consumers had no alternative but to forgo consumption, barter for, or steal any apples they consume in excess of what they themselves could grow or receive from their family and neighbors. In contrast, as the total number of apples sold each season increased over time at the Farmer’s Market, farmers had more capital to invest in increasing production — e.g., buying more land, planting bigger orchards. Markets thus provide a bootstrapping mechanism for the frequency of production to increase with increasing frequency of consumption. Conversely, decreasing frequency of consumption will lead over a period of years to a decreasing frequency of production. The end result is a modulation of frequency that synchronizes cumulative production with cumulative consumption. In the example shown in Figure 3, cumulative production slightly exceeds cumulative consumption. If this surplus of production persists throughout the season, we might reasonably expect cumulative production to decrease, perhaps with some of the smaller orchards disappearing or some of the larger orchards investing less in production in the next annual cycle.
Synchronization of production with consumption is aided by the stabilizing role that markets play by aggregating consumption and production across larger areas and longer periods of time. Apple orchards take years to grow, apples take minutes to eat. While no planning process is perfect, markets help apple farmers to plan their annual production by aggregating up smaller, local cycles of consumption across a wide area into larger, more stable frequency distributions of consumption. When each cycle of consumption in the frequency distribution of consumption is independent of other cycles of consumption, the frequency distribution of consumption is more likely to converge to a stable shape.[4] With stable expectations of the frequency of consumption, producers are less likely to get wiped out by overextending production. Similarly, consumers can either increase or decrease their frequency of consumption in response to more stable expectations of production. In general, markets allow the frequency of consumption to modulate in response to incremental changes in production and the frequency of production to modulate in response to incremental changes in consumption. Aggregated cycles of consumption and production produce more stable frequency distributions of consumption and production.
Average market prices are simple to calculate: the total amount of currency paid for a quantity of goods or services over a given period of time divided by the total quantity of goods or services sold during that period of time equals the average market price for a given quantity of goods or services during that period of time. For example, the average market price at the Farmer’s Market is the total number of dollars paid for all apples sold at the Farmer’s Market that week. The absolute number of dollars paid is a complex function of many other variables, including the opportunity cost of the dollar as measured against a bundle of other currencies, goods, or services. The existence of currency markets further complicates the analysis. For simplicity, we can assume that changes in price due to changes in currency value are small during a given period of time. The value of a dollar changes much less from week to week than even the smallest mismatch between cumulative production and cumulative consumption.
Given that assumption, a stable market price obtains when the frequency distributions of consumption and production are stationary, not changing from period to period. When the frequency distributions are stationary, no single consumer or producer acting independently can drive up or down the last period’s average market price: The effect on average price of an apple buyer who bids lower for a larger volume of apples earlier in the morning is precisely offset by the farmer who asks more for a smaller volume of apples later in the morning as inventory dwindles. Likewise, the effect on average price of a farmer who asks more for a smaller volume of apples earlier in the morning is precisely offset by the apple buyer who bids lower for a larger volume of apples later in the morning as the volume of bids dwindles and inventory remains plentiful. So long as the frequency distributions remain stationary, an increase (or decrease) from the average market price in one transaction results in an offsetting decrease (or increase) from the average market price in a later transaction within the same period. Without a change in the frequency of distributions of consumption or production, market price signals only fluctuate around the average market price established for those frequency distributions during the prior market cycle.
Part 3. Market Price Signals and Instability
Coupling and Decoupling
The phase shifts and frequency modulation described in Part 2 arise from mismatches in cumulative frequency distributions of production and consumption that are small relative to the total volume of production and consumption. Small mismatches cause only incremental changes in average market price from one period to the next. With larger mismatches, however, market prices can become too noisy for production and consumption to synchronize. When market prices are stable, the coupling between consumption and production is also stable because planning from cycle to cycle simply means multiplying an increase to the cycles of consumption or production times the average market price. Each producer or consumer can estimate with reasonable accuracy how a decision to increase or decrease their personal frequency of production or consumption will result in an increase in revenue or expenses. But as changes in either cumulative consumption or production become large relative to total consumption or production from one period to the next, the coupling of consumption and production through market price signals starts to break.
When production and consumption are coupled, market price signals balance cycles of consumption against cycles of production, with slower consumption slowing production, and faster consumption speeding up production. The coupling between consumption and production forms a negative feedback loop, in which decreases in production decrease consumption (and vice versa), or increases in production increase consumption (and vice versa). Market price signals are in this way analogous to the cruise control system in a car, which applies or removes acceleration in order to keep the car operating close to a set speed. The market price signal plays a dual role of setting the speed for both consumption and production.
When production and consumption decouple, market price signals turn consumption or production into a positive feedback loop, with buyers driving up prices further by accelerating cycles of consumption to avoid price increases, or sellers pushing prices down further by accelerating cycles of production to avoid further price decreases. The bubbles and crashes that are familiar in economic history are manifestations of positive feedback loops in buying or selling. At the most basic level, a market bubble results when production and consumption cannot synchronize, either or both because buyers do not delay or slow down buying in response to a deficit in production or because sellers do not sell earlier or faster in response to surplus consumption. The market price gaps up until sellers can phase shift or increase their frequency of production to match the new higher frequency of consumption. After sellers step in at the new, higher price levels, if the new higher frequency of production is matched with the new higher frequency of consumption, then production and consumption are effectively recoupled, and prices stabilize at the new level. If, however, the new frequency of production is higher than the frequency of consumption, then the positive feedback loop may flip into reverse because sellers do not delay or slow down selling in response to a deficit in consumption or because buyers do not buy earlier or faster in response to surplus production. The market price gaps down until buyers can phase shift or increase their frequency of consumption to match the new higher frequency of production. Like population size under the logistic map as growth rate increases beyond a certain threshold, when the mismatch between the cumulative frequency of production and the cumulative frequency of consumption within a period exceeds a certain threshold, market price signals may bifurcate, oscillating between a higher range in one period and a lower range in the next. Even larger mismatches between the frequencies of production and consumption may give rise to further bifurcations or chaotic oscillation among many different price ranges.
Bringing Order to Chaos
Gathering detailed information about frequency distributions of production and consumption is difficult. It is advantageous for higher frequency consumers and producers to keep information about their cycles private, disclosing only their bids and asks in response to market price signals. But as Coase observed in The Nature of the Firm, when production is easier to synchronize with consumption using private information and central planning rather than market price signals, entrepreneurs start firms to organize production, thereby matching an increased tempo of consumption. The emergence of firms within a market thus represents one mode of response to chaotic market price signals.
Other responses to market instabilities are possible. In general, a stabilizing response keeps differences between the cumulative frequency of production and the cumulative frequency of consumption within a range below a threshold that results in an oscillation in average market prices from one period to the next. Thus, if we were to observe an oscillation or chaotic change in the average market price of apples at the Farmer’s Market from week to week, we should look into whether the gap between the frequency of production and consumption can be narrowed, at least temporarily, by limiting the frequency of consumption (for example, through a limit on the number of apples each consumer can purchase) or the frequency of production (for example, by limiting the number of farmers who can sell apples that week).
The use of leverage and financial instruments in markets can have a stabilizing or destabilizing effect on market price signals depending on whether their use tends to narrow or widen the gap between cumulative production and cumulative consumption. Every loan creates its own cycle of borrowing and repayment, which need not be tied to the frequencies of production or consumption. A loan extended to a farmer early in the year, which helps the farmer increase production to meet a deficit that was observed in last year’s season, might be stabilizing. But if too many such loans are extended to too many farmers, then the ultimate effect of the loans may be to create a surplus of production, which in turn leads to the kind of instability described above. Similarly, the use of financial instruments to guarantee minimum or maximum average prices may be stabilizing if the gap between consumption and production is temporary or destabilizing if the gap between consumption and production persists.
Conclusion
Production and consumption occur in cycles, with characteristic frequencies over a given period of time, which can be summarized in histogram frequency distributions (Figures 1 and 2) or cumulative distributions (Figure 3). Markets synchronize production with consumption through phase shifts and frequency modulation using market price signals. Market price signals close a feedback loop for cycles of consumption and production, with changes in the price of bids, asks, and completed transactions giving producers and consumers high-frequency feedback on how well production and consumption are synchronized. So long as the differences between cumulative consumption and cumulative production do not exceed a threshold, production and consumption remain coupled, with a stable market price signal closing a negative feedback loop between production and consumption. When either consumption or production are mismatched beyond the threshold, production and consumption decouple and market price signals enable a positive feedback loop, with corresponding market instability in the form of bubbles and crashes.
See Food Sharing among Hadza Hunter-Gatherer Children and Energy expenditure and activity among Hadza hunter-gatherers ↩︎
See The Future of Law and Economics: Looking Forward and Coases's Journey (podcast) ↩︎
Units of frequency are the reciprocal of units of time. For example, a frequency of 1 Hertz corresponds to one cycle per second. ↩︎
This results from a weak version of the Central Limit Theorem, the stronger version of which provides that independent random variables when summed converge to a normal distribution. For very large aggregated groups, normal distributions may provide a reasonable approximation of frequency distributions of consumption and production. ↩︎